News & Articles
COVID-19 symptoms analysis and clustering methods
Carmen Lai
Color recently published a press release highlighting key results from an analysis of data from over 30,000 individuals who completed a Color COVID-19 test. The press release highlighted that the majority of individuals who test positive reported mild or no symptoms, and only a small percentage had a high fever. Building on that release, we are sharing more details on the analysis methods behind the results.
Understanding how COVID-19 manifests in a broader population is important for obtaining more representative estimates for epidemiological modeling, and ensuring that reopening efforts are effective at a population scale. To date, most published COVID-19 testing data tend to be from cohorts of individuals who are severely ill or at high risk from hospital settings. Color’s testing data differs in that testing was prioritized for a broader population of Bay Area essential workers and residents.
For this analysis, we included results from 30,429 tests with an overall positive rate of 1.3%. The validation data for Color’s SARS-CoV-2 LAMP assay and Color’s FDA Emergency Use Authorization (EUA) can be found here. As part of the testing workflow, people self-reported their symptoms through an online pre-test questionnaire. The aggregated and de-identified answers to these questionnaires were used to investigate a few open questions:
What is the estimated asymptomatic rate among positive cases in a general population?
Which symptoms are most highly correlated with a positive SARS-CoV-2 result?
What is the predictive performance of a symptoms-based model for a positive SARS-CoV-2 result?
Key Takeaways and Implications for Reopening
This data presents a broader survey of SARS-CoV-2 positive cases than in previously published data, which were often limited to high-risk individuals in hospital settings. This data is inclusive of younger age groups, multiple ethnic groups, and more individuals who tested positive with no reported symptoms, which help us improve model estimates for a broader population.
Symptoms screening may not be sufficient in containing an outbreak. Among positive cases in our data, 30% report no symptoms at the time of testing and 48% report mild symptoms that are difficult to distinguish from cold and flu symptoms. Additionally, a symptoms-based predictive model achieves a relatively low diagnostic accuracy of 0.74 AUC for SARS-CoV-2 positive result prediction.
Fever checking will likely miss the large majority of positive cases in a broader population. Only 12% of individuals who tested positive report a high fever, making it one of the least reported symptoms among positive cases.
Proactive testing for all employees upon re-entry to work may be more effective than symptoms-based testing alone, given the wide spectrum of symptoms or lack thereof reported in SARS-CoV-2 positive cases from widespread testing. Read more about Color’s recommended return-to-work testing strategies here.
Limitations of our data
Hospitalized cases: Our testing workflow was primarily made available to SF residents and essential workers who are able to schedule an appointment come to one of our drive-through testing sites. As such, our data set does not include the most severe cases of COVID-19 which require hospitalization.
Longitudinal data: We did not design the testing workflow to collect longitudinal follow-up data. As such, for most individuals in the cohort, we do not have data on progression of symptoms or outcomes such as recovery or fatality.
Symptoms Clustering Methods
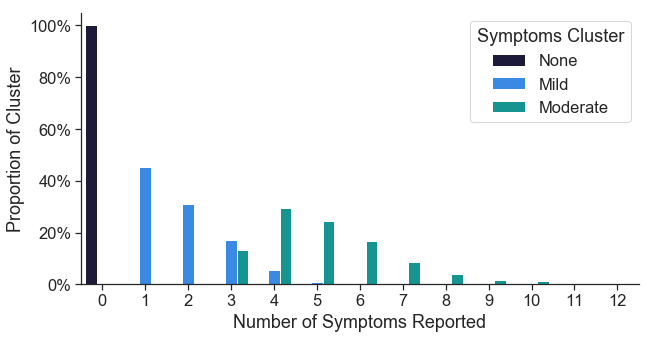
Individuals in this cohort reported their experienced symptoms using an online questionnaire before scheduling their appointment. All 30,429 tested individuals completed this questionnaire: 53% reported 0 symptoms, 29% reported 1-2 symptoms, and 18% reported 3+ symptoms.
Unsupervised clustering summarizes self-reported symptoms data
We noticed that many symptoms, such as headache and fatigue, tend to be reported together. We used k-means clustering to better characterize and understand symptom correlations in our cohort. The resulting clusters were differentiated by both number of symptoms and types of symptoms. We assigned ‘none’, ‘mild’, and ‘moderate’ labels based on human interpretation of the resulting clusters. We intentionally excluded ‘severe’ as a label, as our cohort does not include the truly severe cases of COVID-19 which require hospitalization.
Symptom clusters differentiate based on number of symptoms reported
The ‘mild’ cluster centers around 2 reported symptoms, while the ‘moderate’ cluster centers around 5 reported symptoms. The ‘none’ cluster includes all individuals who reported that they experienced no symptoms at the time of testing.
Symptom clusters differentiate based on types of symptoms reported
In addition to the number of symptoms reported, the clusters also differ in the types of symptoms reported. Cough and headache were the predominant symptoms reported in the ‘mild’ cluster. The ‘moderate’ cluster saw more frequent reports of body aches, fatigue, chills, and shortness of breath relative to the ‘mild’ cluster.
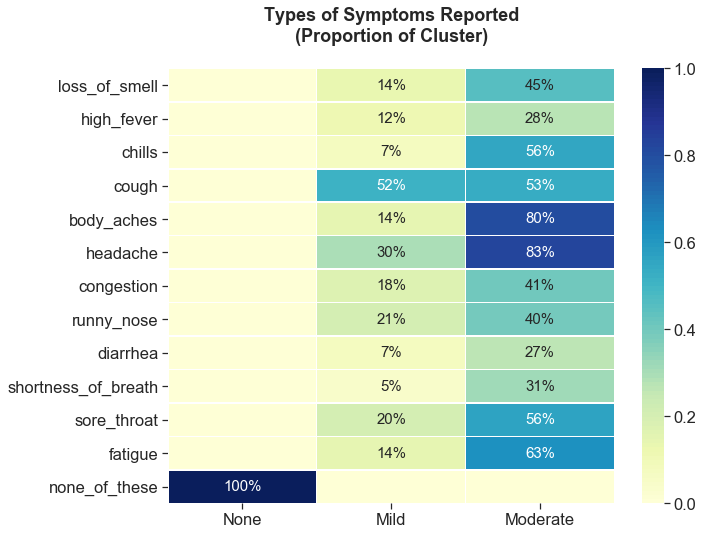
Mild: 1-3 symptoms (cough, headache)
Moderate: 3-12 symptoms (body aches, fatigue, chills, and shortness of breath)
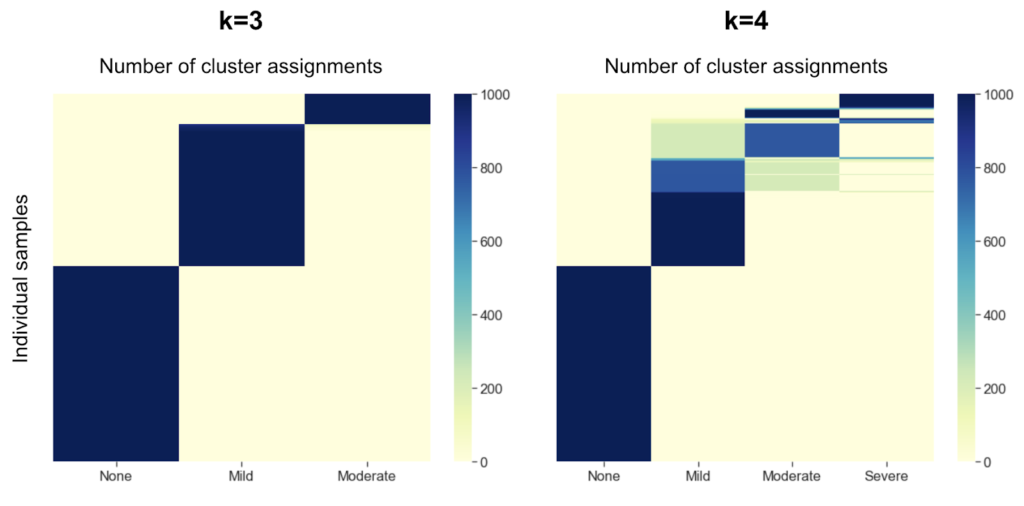
How were three clusters chosen?
One of the key parameters when performing k-means clustering is the desired number of resulting clusters. There are a variety of ways to choose the optimal number of clusters, and there is often not one definitive way to do so. Commonly used methods in the field include the elbow method or the silhouette method, however the optimal k number of clusters was unclear based on these methods in our data. Empirically, we found that with k=3 clusters, samples were more consistently assigned to the same cluster across 1,000 trials (98% of samples consistently assigned to the same cluster) than with k=4 (75% of samples consistently assigned). Based on this empirical observation, we chose k=3 for our analysis.
Symptoms Screening
Based on symptoms clustering, we found that the large majority (78%) of individuals who tested positive for SARS-CoV-2 reported either mild symptoms (48%) or no symptoms (30%). Our result is similar to estimates released by the World Health Organization, which states that 80% of SARS-CoV-2infections have mild or no symptoms. This presents a few challenges for COVID-19 screening:
- Mild symptoms will be largely uninformative of SARS-CoV-2 infection status and may be easily ignored, particularly during cold and flu season.
- A high rate of no symptoms reported among positive cases is problematic given how contagious the virus is thought to be, even in asymptomatic or pre-symptomatic carriers.
Given a high rate of no symptoms reported among positive cases, symptoms screening alone will not be a sufficient tool to prevent community spread. Color has collected more comprehensive data on infection rates among essential workers, who were prioritized early in the testing process. About 36% of essential workers who tested positive reported having no symptoms, which suggests the asymptomatic rate among positives in the overall population may be higher than 30%.
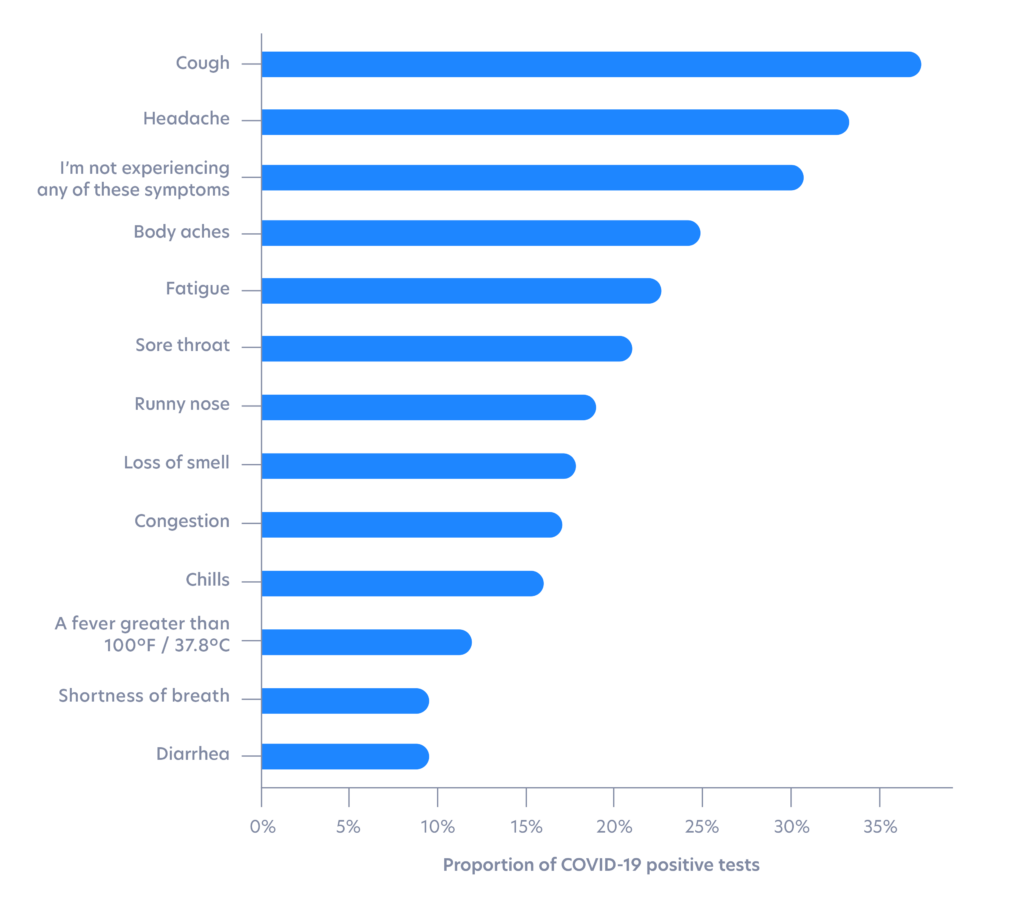
Fever is one of the least reported symptoms among positives
The most common symptoms reported among individuals who tested positive include cough (37% of positives) and headache (32% of positives). In contrast, a high fever is one of the least commonly reported symptoms (12% of positives), despite the emergence of fever checking as a primary and often only implemented method for screening.
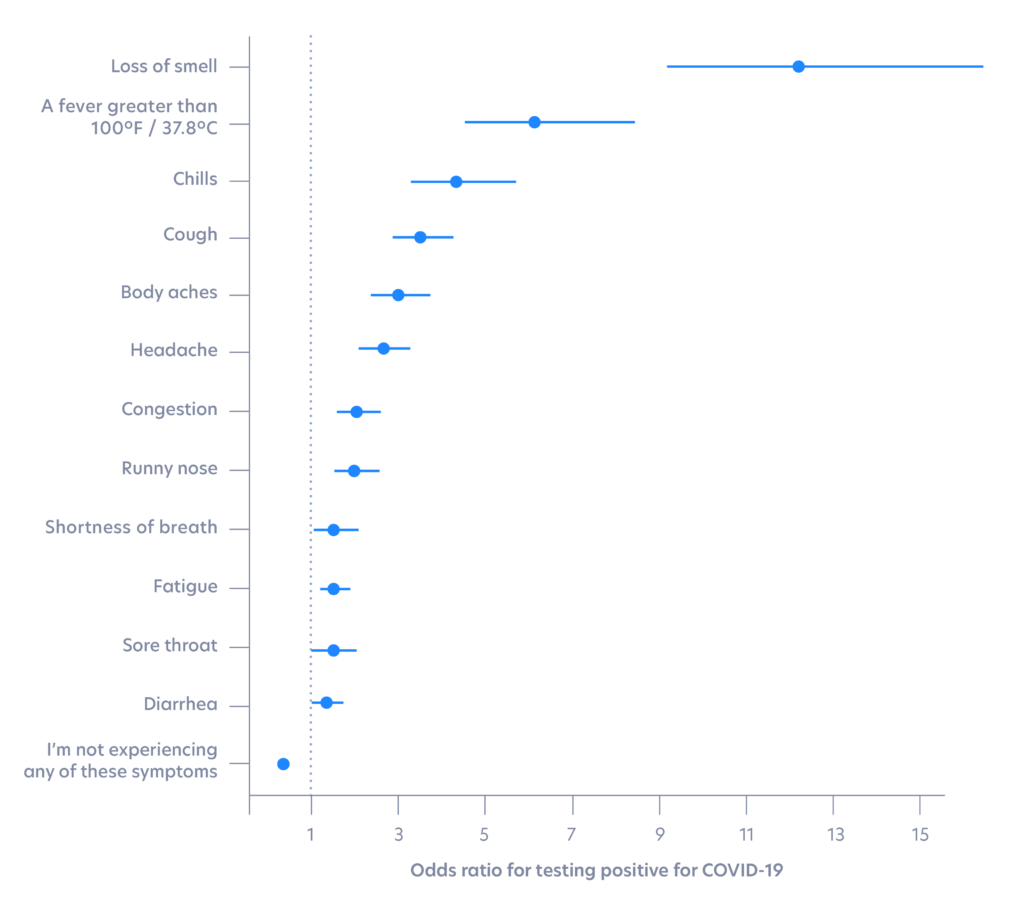
Loss of smell is the most highly correlated symptom with testing positive
In our analysis, loss of smell is a top predictor among symptoms for a positive SARS-CoV-2 result. Using L2-regularized logistic regression with age and gender covariates incorporated, we found that loss of smell was more correlated with testing positive than high fever, as shown by odds ratio below. A similar finding was published in Nature based on symptoms data from a smartphone app.
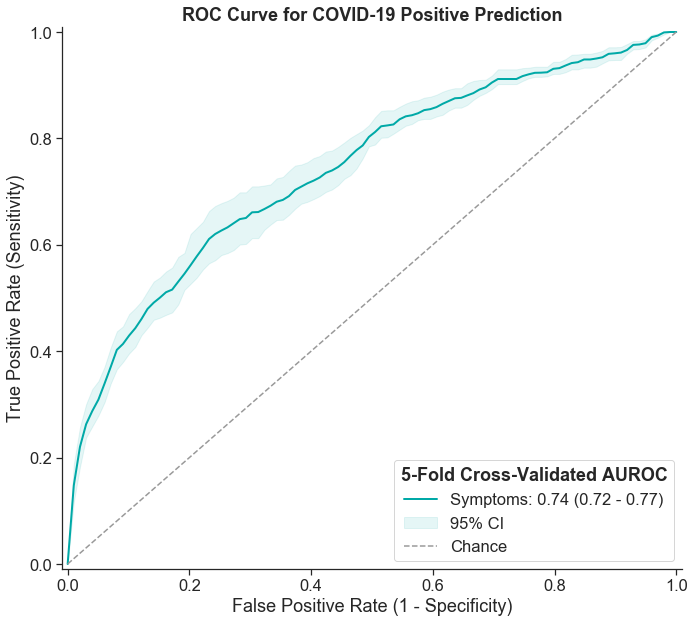
In our analysis, we can use symptoms data to estimate the value of symptom checking as a screening measure. To do this, we assessed how well a symptoms-based predictive model is able to discriminate SARS-CoV-2 positive results in our data set. The performance of a classification model like this is often quantified using the AUC (area under the curve) for the ROC (receiver operating characteristic) curve. This is a commonly used metric in both scientific and machine learning communities.
Symptoms-based screening as a standalone measure is not enough
We trained an L2-regularized logistic regression model using symptoms along with age and gender as feature inputs. We chose ridge (L2) regularization, a modeling method that is known to account for potential correlation between features, which we expect is true with symptoms data. Using this model, we found that the AUC is 0.74 (95% CI 0.72-0.77). This is consistent with AUCs reported in published literature on other similar symptoms-based predictive models. While an AUC of 0.74 indicates strong correlation between symptoms and a SARS-CoV-2 positive result, this value is still quite low from a diagnostic standpoint, particularly in comparison to the high AUCs typically required for medical diagnosis (>0.95 AUC).
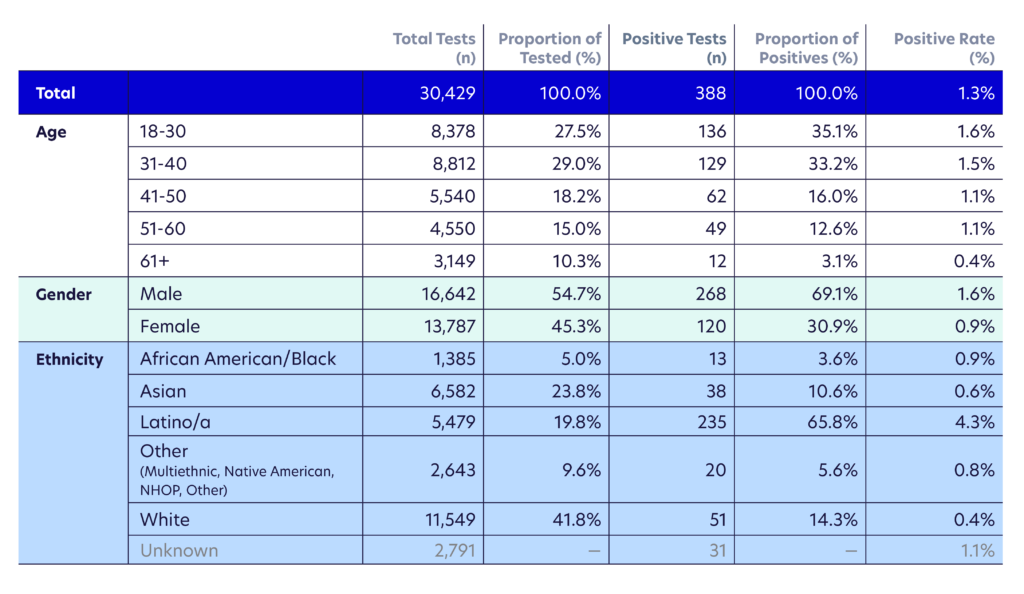
Majority of individuals who tested positive are young people
The majority of people who tested positive in this population were relatively young — between ages 18 – 40 (68%). Relative to all testing reported in the city of San Francisco, the age distribution of the positive cases in our cohort skewed younger. We believe this may be due sampling bias in our testing for more working-age individuals.
Minority communities are disproportionately impacted
Our data confirms disparities in ethnic background for individuals who received a positive result. The Latinx population represented 66% of positive results in our cohort, but made up only 20% of those tested. Positive rates were higher among Latinx (4.3%) and African-American (0.9%) individuals in our cohort as compared to White and Asian (0.4% and 0.6%, respectively). As we may expect, Latinx and African-American individuals in our cohort were also more likely to be essential workers compared to White (87% Latinx and African-American compared to 70% White self-reported as essential workers).
To read more about return-to-work testing strategies, and for more information on Color’s COVID-19 response, visit https://www.color.com/covid.
**Analysis review provided by Anjali Zimmer, PhD and Julian Homburger, PhD
About Color
Color is a leader in distributed healthcare and clinical testing. Color makes population-scale healthcare programs accessible, convenient, and cost-effective for everyone. Color works with health systems, employers, and national health initiatives around the world including the million-person All of Us Research Program by the National Institutes of Health. For more information about Color and its response to COVID-19, visit www.color.com.